
|
 |

|
|
AN ALARM ANALYSIS EXAMPLE One of GoalArt's diagnostic functions is alarm analysis. This function analyses complex alarm situations and can point out the primary alarms, that is, the root causes. In this way, the system helps the operators to understand the fault situation. ALARM CASCADES Complex industrial processes are often equipped with a very large number of alarms. This is to make the process easier to monitor and thereby safer. However, in complex fault situations, this may cause large amounts of alarms from consequential faults, so-called alarm cascades. In such situations, the control system may overload the operators so that the situation becomes incomprehensible for a certain time. For example, in the Harrisburg accident, there were some 800 000 alarms in the first two hours, and the operators could not make sense of the situation. Alarm cascades cause problems in aviation, power industry, chemical plants, nuclear power plants, medical instrumentation, large engines, etc. This is a regular problem in most of today's alarm systems. AN ALARM CASCADE EXAMPLE This example is taken from a test run of a nuclear power plant simulator at KSU, in Studsvik, Sweden. An example process interface could look like this: 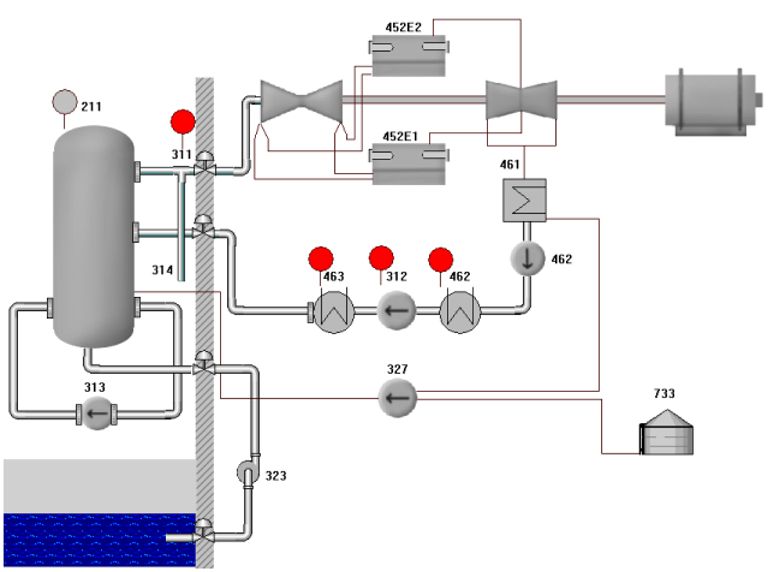 Click to enlarge. Here we see the reactor, the turbines, the condenser, the preheaters, and the feedwater pump systems. Please note that this example is simplified to fit on the web. If we zoom in on the preheater and feedwater pump systems 312, 462, and 463, the screen looks like this:  Click to enlarge. The red T alarms are low temperatures in the preheaters, and the red F is a low flow through a shell valve. The standard (old-fashioned) way of presenting alarms is as a list in an alarm window:  Click to enlarge. USING ALARM ANALYSIS Using the GoalArt alarm analysis function, it is possible to separate primary from consequential alarms. In the example, primary alarms are shown in red, while secondary are shown in yellow. 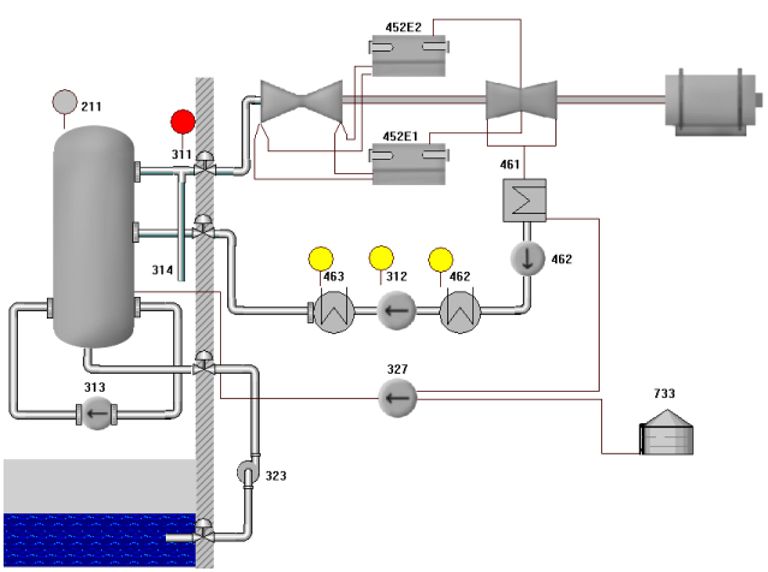 Click to enlarge. From this, we can see that the low flow through the shell valve is the only primary alarm, while all the low temperature alarms are caused by it. In the zoom-in presentation the situation looks like this: 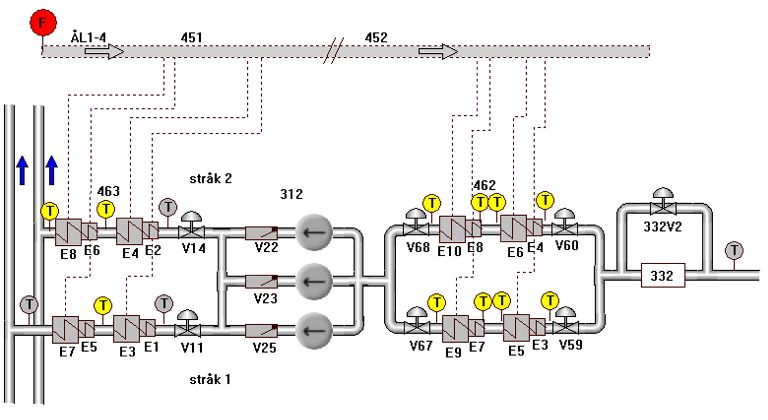 Click to enlarge. Using two alarm lists, we can show the primary alarms in one list: 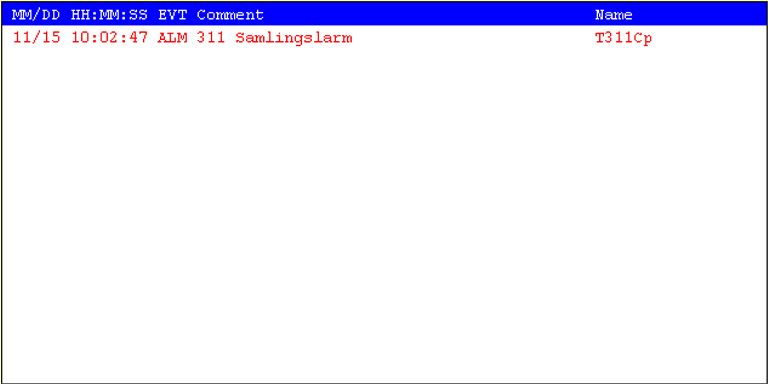 Click to enlarge. And we can show the consequential alarms in another list:  Click to enlarge. From this example, it can be seen that the low flow through the shell valve is the cause of all the temperature alarms, that is, a single alarm causes all the other fourteen. In the Harrisburg case, our alarm analysis algorithm would have reduced the alarm cascade of more than 800 000 alarms to a single one, (a leak through the pilot-operated release valve). BENEFITS OF ALARM ANALYSIS Alarm analysis helps the operators to separate the primary from the consequential faults, that is, to understand the current fault situation better. This gives the following advantages:
OTHER APPLICATIONS  Alarm analysis can be useful under other circumstances too. For example, modern airplanes are equipped with tens of thousands of sensors. After an engine problem, the maintenance personnel must investigate an enormous amount of information without committing errors. This often leads to long delays during the search and analysis. GoalArt's fault diagnosis algorithm provides automated support for an efficient and correct diagnosis, and the alarm analysis will aid by suppressing any consequential effects of the original faults. OTHER ALGORITHMS Alarm analysis is just one of GoalArt's products. We offer several algorithms, which will give the operators increased understanding of the process and operating state, especially in unexpected and dangerous situations. Read more: Diagnostic Functions Read more: Analytic Services |
||
|
GoalArt, Scheelevägen 17, 223 63 Lund, Sweden, Phone: +46 46 286 4880, Fax: +46 46 286 4882, E-mail: info@goalart.com, Web: www.goalart.com. |